
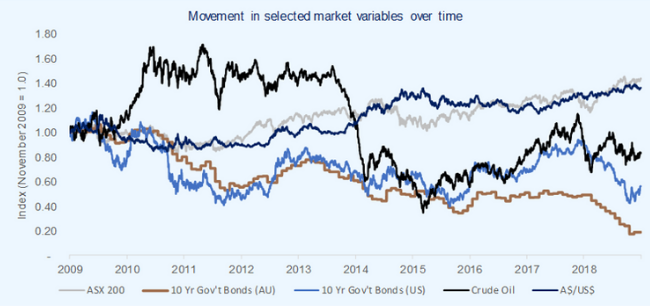
Evaluating projects and transactions is a critical decision for boards and management teams. This process is becoming increasingly complicated due to the recent volatility of equity markets, interest rates, exchange rates and commodity prices as illustrated in the figure below:
For example:
- Due to aggressive global monetary policy post the global financial crises, 10 year Australian bond yields recently fell from approximately 5.5% in 2009 to an all-time low of 0.90% which was 360 bps below the long term average of 4.5% over the last 20 years. Viewed in isolation without due consideration to other changes, this could have significant impacts on target investment returns.
- Earnings and cash flows have also demonstrated volatility due to a range of factors including changes to input costs and foreign exchange rates. For example, costs linked to the oil price are often a key input for many large capital projects. Due largely to geopolitical issues, the spot price of oil has been very volatile in recent years ranging between US$26 and US$127 per barrel with a current spot price approximately US$60 per barrel.
Addressing this volatility in investment decision making, particularly in respect of cash flow forecasting and determining an appropriate weighted average cost of capital (“WACC”) and/or hurdle rate for an investment, has therefore become increasingly difficult and subject to more scrutiny from boards and other decision makers.
As a result, we have received several requests from boards and management teams to assist them in making informed decisions about potential investments.
We therefore thought it would be useful to provide a brief overview of some of the key tools available for project evaluation and discuss how we address the impact of volatility in key inputs into the analysis.
Available tools
Using the wrong tool, or the wrong data (garbage in, garbage out) can lead to incorrect decisions being made and the potential to destroy capital. There are a number of tools that we see clients use in practice to evaluate investment opportunities which include discounted cash flow analysis (“DCF”), payback period, hurdle rates and other implied return metrics.
The International Federation of Accountants has issued a Good Practice Guide titled “Project Appraisal Using Discounted Cash Flow” which states:
“Investment (project) appraisal and capital budgeting, which involve assessing the financial feasibility of a project, should use Discounted Cash Flow (DCF) analysis … to (a) compare costs and benefits in different time periods and (b) calculate net present value.”
We also consider that a DCF analysis is the best tool for investment evaluation, particularly in a volatile environment as it is best able to capture different economic and asset specific scenarios.
However, the numbers can only tell part of the picture as it is critical that due consideration be given to the alignment of the potential investment with an organisation’s strategy.
Whist the DCF is the most theoretically robust approach, it is constrained by the quality of the inputs and the rigour of the underlying analysis undertaken to estimate the inputs and evaluate the outputs.
We therefore discuss below a brief summary of what we consider to be some of the key issues in the application of the DCF approach in the current environment as well as discussing some of the alternative approaches to investment evaluation.
DCF analysis
Introduction
DCF analysis is the ‘procedure used to calculate the present value of future cash flows’ and this present value can be compared to the initial capital cost of a project. However the utility of this approach is heavily dependent on the quality of the inputs into the model. Ensuring the inputs used in the analysis are reasonable and the outputs make sense is therefore critical.
Cash flows
In terms of the cash flows included in the analysis:
- The cash flows should generally be:
- in nominal terms (including inflation).
- excluding interest or other funding costs as project evaluation is often separate from the funding decision. However, if the funding structure varies over time or is a critical aspect of the investment evaluation (such as infrastructure projects or project finance) then it may be more appropriate to consider post-funding cash flows.
- Post-tax as the tax profile of the investment can have a significant impact on the decision. It may also be necessary to consider any tax step-up benefits in the underlying assets as this could impact the investment decision.
- The DCF analysis should only consider expected cash flows that could change if the proposed investment is implemented.
- Inclusion of any synergy benefits should be used with caution, particularly future revenue synergies as these are subject to greater risk and uncertainty.
Whilst past results may provide some guidance as to future assumptions, key inputs (such as growth rates, margins, input costs, etc) are not likely to be static and may change over the forecast period. For example, as mentioned above, the spot price of oil has ranged between US$26 to US$127 per barrel with a current spot price approximately US$60 per barrel. However, the price implied in the trading of futures contracts implies a progressive price decrease to US$50 per barrel to 2022 according to S&P Capital IQ.
Ensuring a reasonable position is adopted for all cash flow inputs (which may include multiple scenarios) having regard to past results and future expectations is therefore critical.
Discount rate
When selecting a discount rate:
- The discount rate must be prepared on a consistent basis with cash flows being valued. Post-tax nominal cash flows before interest (which is commonly used for investment evaluation) must be discounted at a post-tax nominal WACC. An example of this approach is set out in our DCF model. Alternatively, if post funding cash flows are utilised, a post-tax nominal cost of equity should be used to discount the cash flows.
- If the analysis of the cash-flows excludes tax, it is not usually appropriate to simply gross-up the WACC or discount rate by the tax rate, other than in very simple scenarios (i.e. static cash flows). We therefore recommend undertaking the analysis on a post-tax basis as mentioned above.
- Rather than using a detailed build-up of the WACC in the analysis, some companies adopt more subjective project hurdle rates based on group policies, previous acquisitions or other sources. Best practice would be to build-up a discount rate which reflects the market inputs at a point in time and allows appropriate consideration for any investment-specific factors such as size, region, etc.
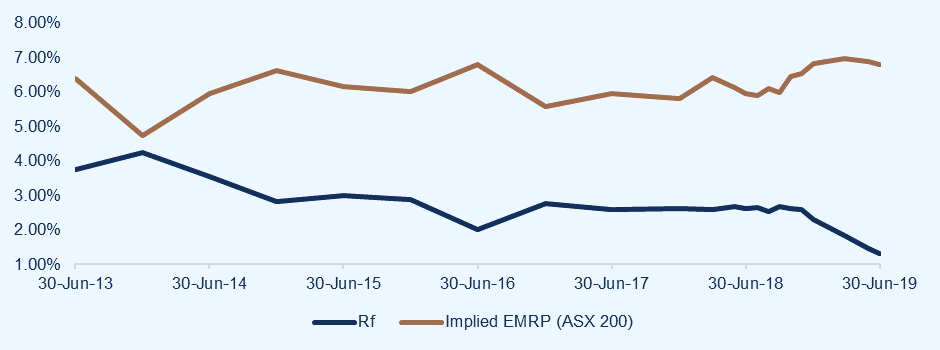
A discount rate is not static and must be reflective of the market at the time of the investment decision. For example, whilst we have recently observed historical low risk-free rates (as measured by government bond yields discussed above), this has been partially offset by an increase the equity market risk premium (“EMRP”), which generally moves in the opposite direction to bond yields. This relationship can be seen in the figure below which shows movements in the yield to maturity of the Australian 10 year government and the EMRP implied by the ASX 200 index:
While the discount rate is one of the most critical and subjective aspects of the assessment, unfortunately it does not always attract the level of rigour it demands in the investment evaluation process. We consider this is all the more critical in the current volatile environment.
Hurdle rates
A hurdle rate is the minimum required rate of return, or target rate, that investors are expecting to receive on an investment. The rate is determined by assessing the cost of capital, risks involved, current growth opportunities, rates of return for similar investments and other factors that could directly affect an investment.
To assess a project with a hurdle rate, it is necessary to calculate the annual rate of rate of return from a proposed investment that would equate the present value of the expected cash flows to the upfront investment capital. This is known as the internal rate of return or IRR. The IRR can then be compared to the hurdle rate. If the project IRR exceeds the hurdle rate then the investment should be accretive to the organisation. This tool can also be used to rank projects across an organisation on a consistent basis in order to prioritise investment decisions particularly when availability of capital is a constraint.
However, the decision is not always as straightforward as choosing the investment with the highest IRR. For example hurdle rates can favour investments with high rates of return, even if the dollar amount is small.
Focusing on hurdle rates in isolation could therefore result in an organisation allocating undue costs and resources to investments with minimal net cash flow contribution. Similarly, if only analysing hurdle rates, an organisation may reject investments which can contribute significant incremental cash flows but at lower rates of return. These issues become magnified when an organisation is constrained by the availability of capital, which is typically the case.
When utilising hurdle rates, it is critical to ensure that:
- Any differential risks of underlying investments are reflected in the hurdle rate. For example, a speculative greenfield wind farm in Indonesia has a far different risk profile to an operating wind farm in Australian underpinned by long-term contractual arrangements with a blue chip customer.
- The process / methodology adjusts to changes in the macro environment over time (i.e. risk-free rate, EMRP, funding costs, etc). For example, the impact of historically low bond yields may be to reduce the appropriate hurdle rates. However, given the offsetting increase in the EMRP, the adjustment is not simple.
In addition, some organisation may include a buffer to the ‘theoretical’ or calculated hurdle rate but this is a philosophical decision often influenced by the risk tolerance of the organisation and the availability and cost of capital.
Other project evaluation measures
Payback period
The payback period is regarded as one of the oldest methods of evaluating capital projects, and the easiest to apply.
The payback period is a measure of the time it will take a project’s cash inflows to equal the original investment. At the end of the payback period, a company has recouped its capital investment.
Although the payback period is intuitive and easy to apply and communicate to decision makers, it is inferior to the DCF approach and should be used with caution. This is because this approach does not consider the time value of money since it simplistically assumes all future cash flows pay back the current investment regardless of the period.
For example, assume there are 2 projects with an initial outlay of $100 as follows:
- Project 1: Returns $33 each year for three years
- Project 2: Returns $100 in year 3
Using the payback period, both projects have a payback period of three years but which is lower risk? What if a third project involved a return of $300 in the fifth year. Is it better or worse? What if a third project has a return of $125 in year five? These examples demonstrate the shortcomings of this approach in insolation.
A more sophisticated version of a payback calculation uses the DCF method to calculate the payback period. This improves the technique by incorporating the time value of money and the relative risk of each project.
Return on Investment (ROI) or Return on Capital Employed (ROCE)
ROI and ROCE can be defined as accounting profit divided by the book value of the investment supporting the operations. However, it is necessary to be explicit about the exact meaning of the components of this expression, with a common definition being:
Earnings Before Interest and Tax
Investment (Debt and Equity)
The fundamental problems with this form of analysis is that it does not take into consideration the time value of money or the relative risk of the projects. It also often incorrectly excludes required investments in working capital, and there is no way of including potential variable returns (EBIT) in the analysis.
Further assistance and tools
Do not hesitate to contact Leadenhall if we can be of assistance clarifying issues or assisting with the evaluation of a project. We have also made a number of relevant tools available on our website to assist you in any project evaluation. These tools include: