
Optimism around the easing of inflation and potential interest rate cuts led to a rally in equity markets towards the end of December 2023. With markets continuing to fluctuate significantly, the selection of a reasonable discount rate remains a key consideration, whether for the purpose of financial reporting or for any valuation analysis.
The following chart presents a summary of the overall change in our assessment of the weighted average cost of capital (WACC) for the market as a whole from 30 June 2023 to 31 December 2023.
Market discount rates have declined
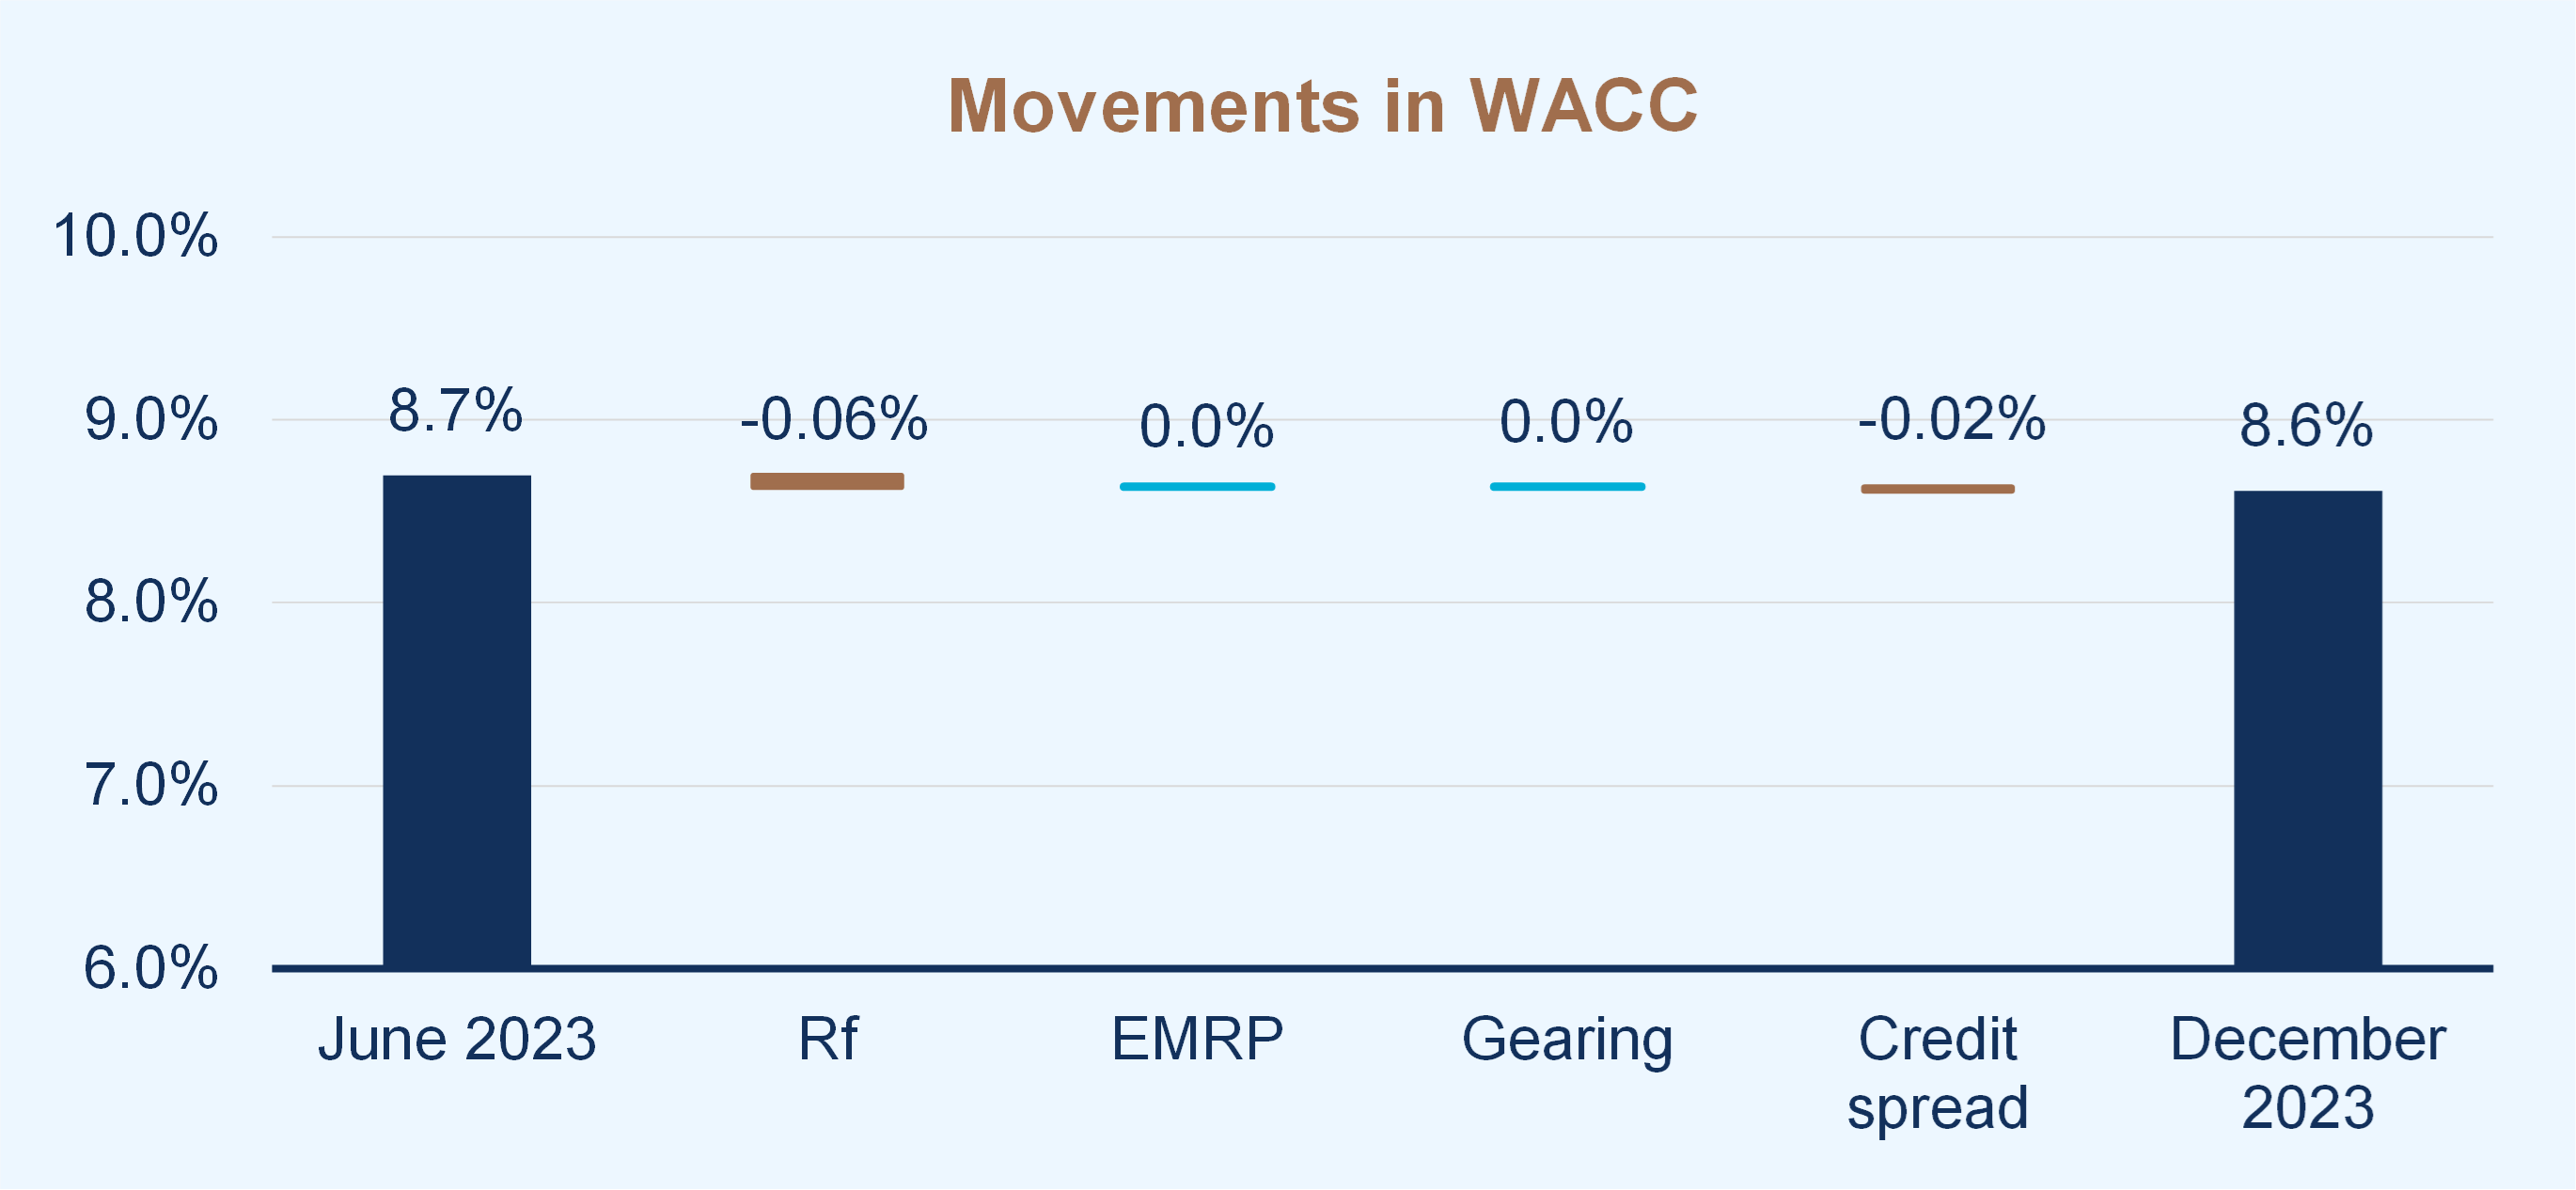
Source: Leadenhall
Note: Movement in WACC is for the overall market and is not company specific.
The cost of capital has decreased slightly over the period due to a small decline in government bond yields and interest rates. All other things being equal, this will lead to slightly higher asset values.
The ongoing market volatility increases the need to adopt the best practice approach of using expected (i.e., probability weighted) cash flows as the basis for valuations. In fact, the greater uncertainty associated with future earnings indicates that additional rigour may be required in developing robust projections. These forecasts should be coupled with an appropriate discount rate.
As recognised experts, this update helps you understand the assumptions we make which you can rely on for a reasonable outcome.
Leadenhall Solution:
Framework
Weighted Average Cost of Capital
Model
WACC = Ke x (E/V) + Kd x (D/V) (1-t)
Components
WACC Weighted average cost of capital
Ke Cost of equity
E/V Proportion of equity in capital structure
Kd Cost of debt
D/V Proportion of debt in capital structure
t Corporate tax rate
V Market value of business (where V = D + E)
Capital Asset Pricing Model
Model
Ke = Rf + β(Rm – Rf) + α
Components
Ke Cost of equity
Rf Risk free rate
β Beta, a measure of exposure to market risk
Rm Required return from investing in the market
Rm – Rf Equity market risk premium
α Company specific risk premium
Application to specific businesses
Determining an appropriate discount rate to apply to a specific business may require consideration of variables and risks unique to that business. This may be addressed through the inclusion of a company specific risk premium in the discount rate.
Selecting the risk-free rate (Rf)
The risk-free rate should be in the same currency as the asset being valued and its maturity should match the life of the investment. In Australia, the most common proxy for the long-term risk-free rate is the yield on ten-year Commonwealth Government bonds which have been as follows:
Risk-free rates remain close to historical lows
June 2023
4.03%
December 2023
3.96%
Change
(0.07%)
Leadenhall Solution:
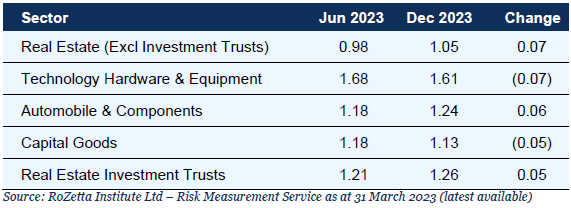
Assessing Beta (β)
Observed industry betas have remained broadly unchanged
Leadenhall Solution:
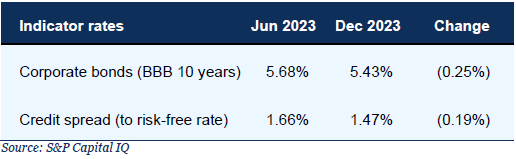
Cost of debt (Kd)
Lending rates are similar to prior periods
Leadenhall Solution:
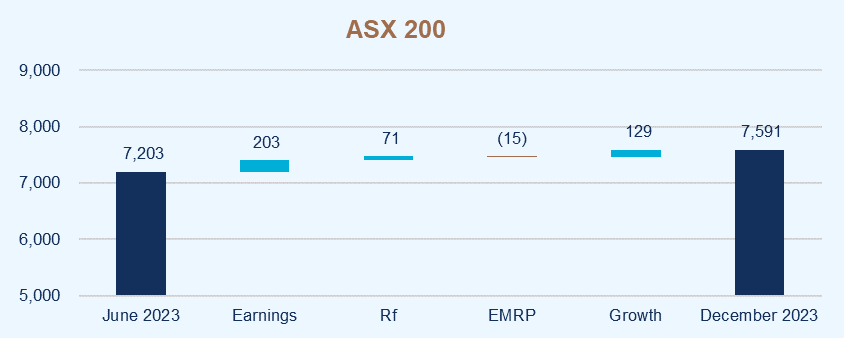
Stable market risk premium
Stable implied EMRP
Leadenhall Solution:
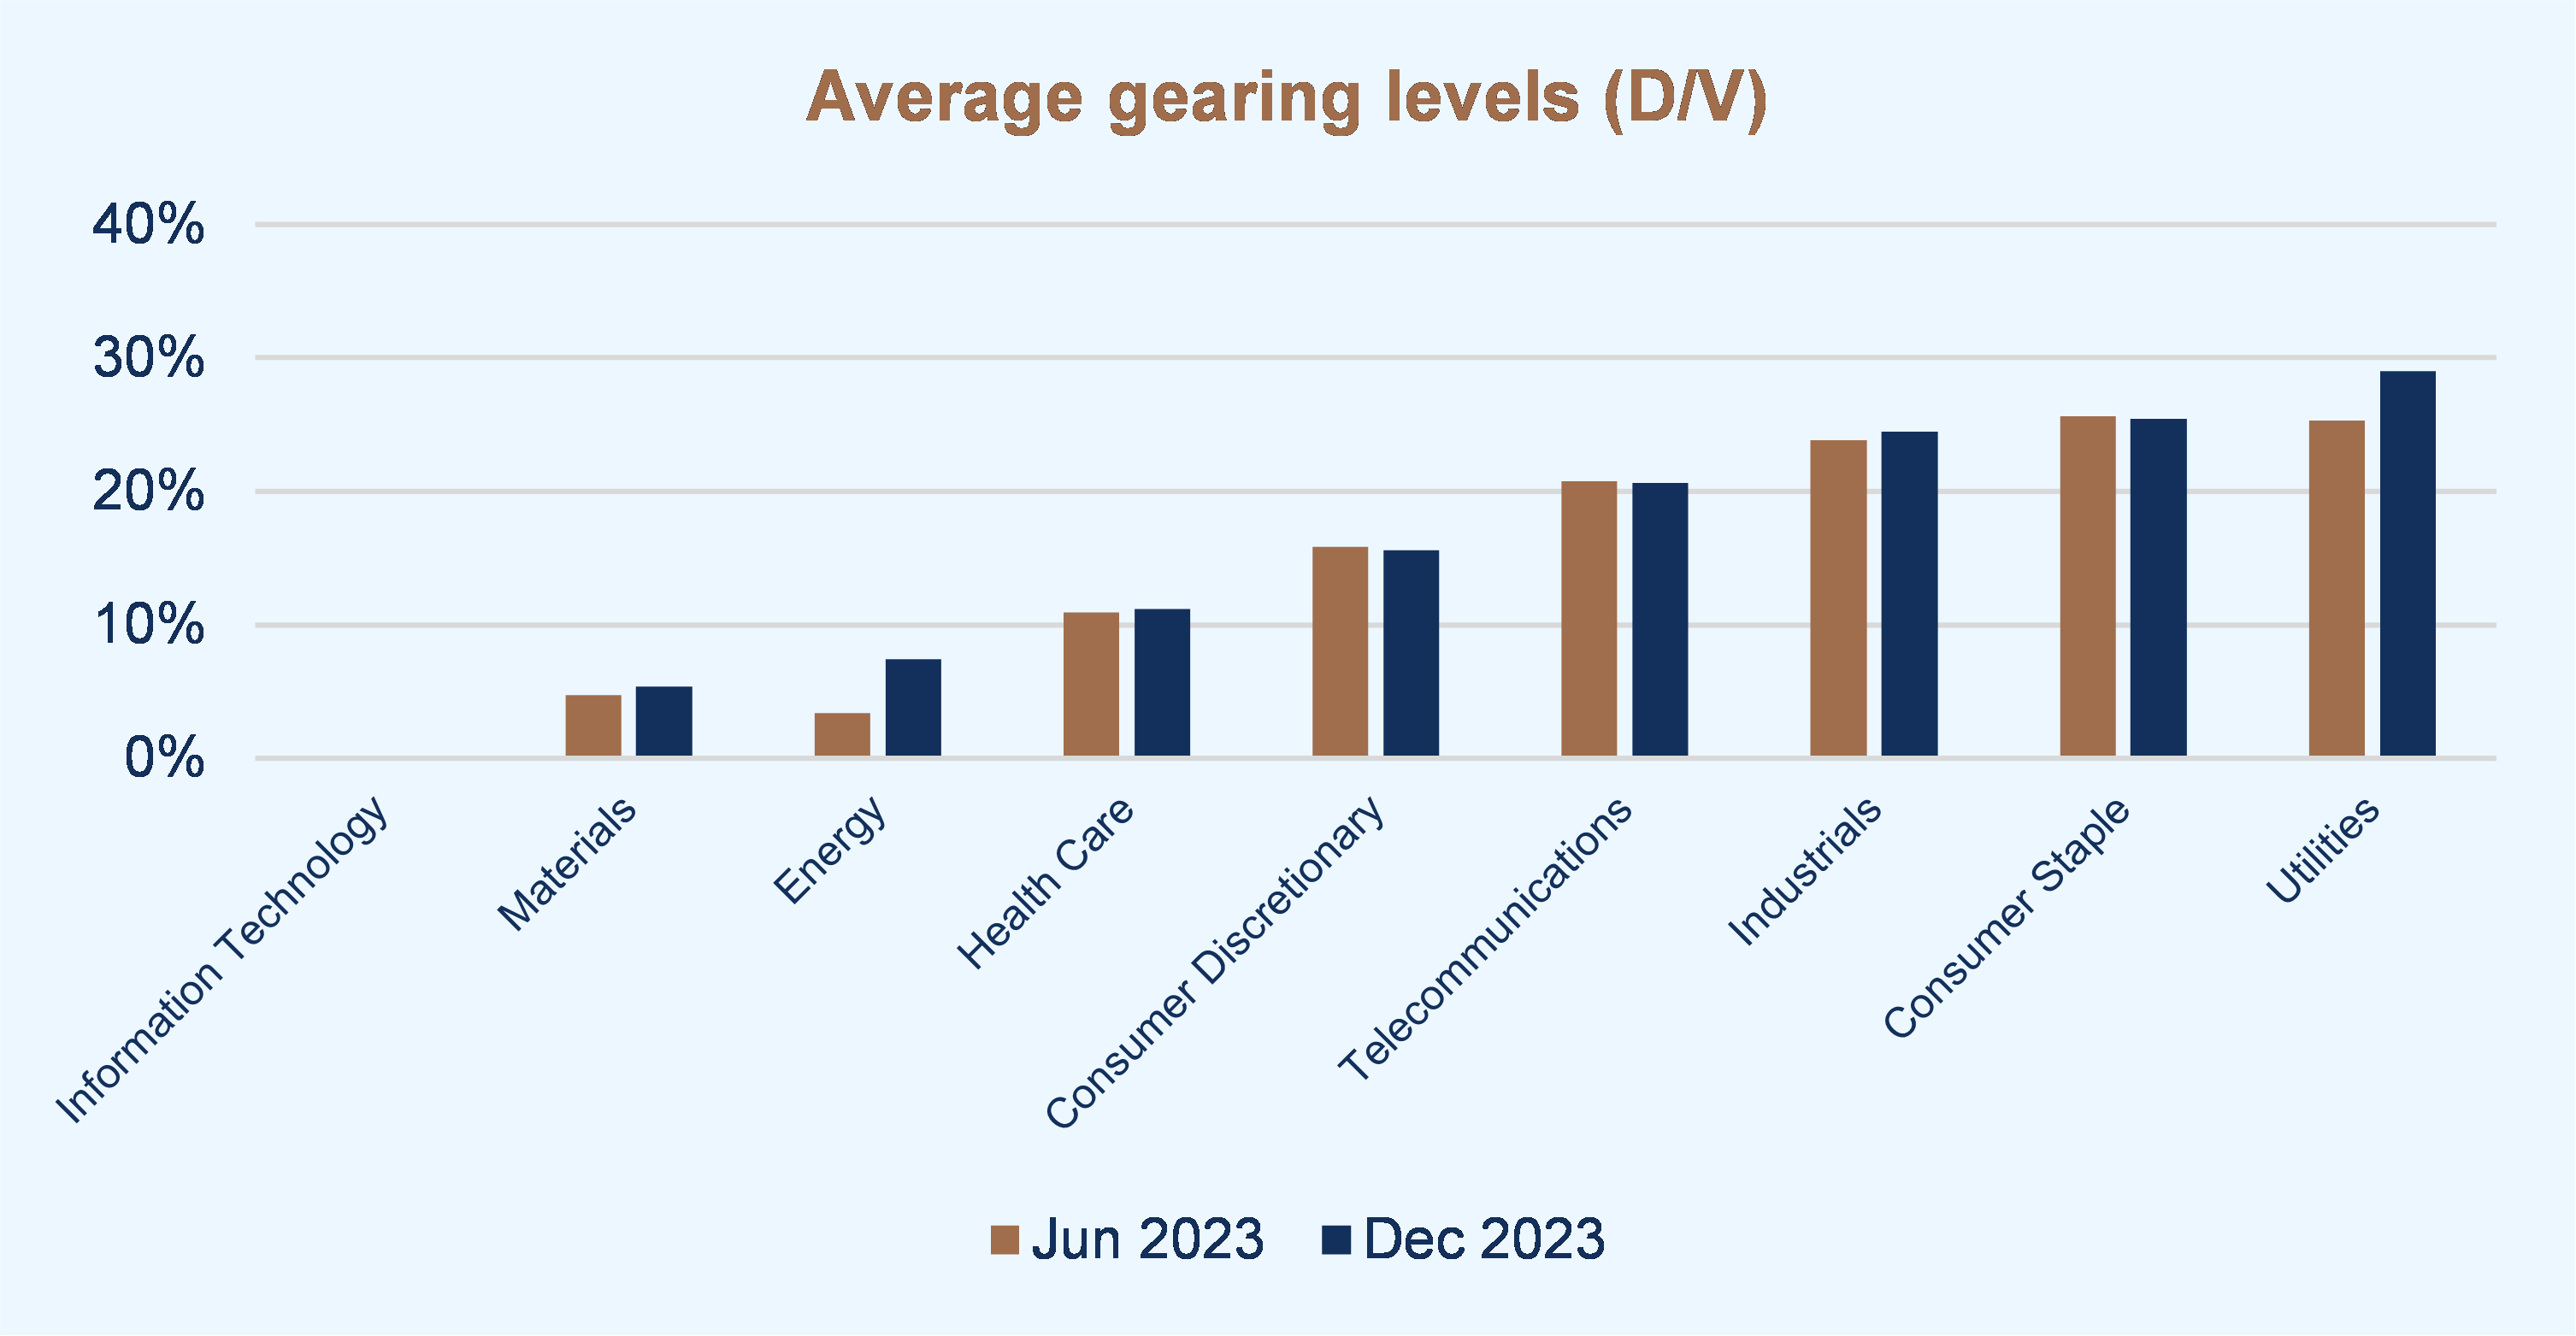
Capital structure
Average gearing levels remain broadly unchanged
Leadenhall Solution:
Our other concerns that may attract attention
Given ongoing market volatility, inflation concerns and the heightened uncertainty around future earnings and cash flows, emphasis should be placed not only on the discount rates adopted but on the preparation of robust cash flow projections. Some common issues we have observed are:
◆ Optimistic forecasts with insufficient allowance for capital investment and/or time to recovery
◆ Inconsistencies between the discount rate and cash flows
◆ Relying on a single valuation methodology without considering any cross-checks.
Our difference
Leadenhall doesn’t just offer thought leadership; it prides itself on knowledge delivery. Reports such as these contain the most recent, relevant information available, clearly presented to go beyond the maths and provide you with a deeper understanding of the critical issues.
This analysis is updated regularly throughout the year with reports issued in December and June in line with full year and half year reporting for most Australian companies. Discount rates herein are expressed in nominal post-tax terms.1
1 Accounting standard AASB 136 – Impairment of Assets requires value in use to be assessed with a pre-tax discount rate (paragraph 55). However, market practice in Australia is to perform this analysis using a post-tax discount rate (and post-tax cash flows), with the implied pre-tax discount rate being disclosed in the financial statements.