1. Market discount rate update - introduction
Inflation and recession concerns continue to drive market volatility, with a deteriorating outlook for the global economy towards the end of December 2022. The selection of a reasonable discount rate therefore remains a key consideration, whether for the purpose of financial reporting or for any valuation analysis.
The following chart presents a summary of the overall change in our assessment of the weighted average cost of capital (WACC) for the market as a whole from 30 June 2022 to 31 December 2022.
Market discount rates have risen
Source: Leadenhall
Note: Movement in WACC is for the overall market and is not company specific.
“Inflation in Australia is too high, at 6.9 per cent over the year to October. Global factors explain much of this high inflation, but strong domestic demand relative to the ability of the economy to meet that demand is also playing a role.”
Philip Lowe, RBA Governor
“Companies may continue to face some uncertainties about future economic and market conditions, and the impact on their businesses. Assumptions underlying estimates and assessments for financial reporting purposes should be reasonable and supportable.”
ASIC – focus areas for 31 December 2022 reporting
The cost of capital has increased over the period due to a rise in the risk-free rate, moderated by a decline in the equity market risk premium (EMRP). All other things being equal, this will lead to lower asset values.
The ongoing economic uncertainty does not alter the best practice approach of using expected cash flows as the basis for valuations. In fact, the greater uncertainty associated with future earnings indicates that additional rigour may be required in developing robust projections. These forecasts should be coupled with an appropriate discount rate.
As recognised experts, this update helps you understand the assumptions we make which you can rely on for a reasonable outcome.
Leadenhall Solution:
2. Framework
Weighted Average Cost of Capital
Model
WACC = Ke x (E/V) + Kd x (D/V) (1-t)
Components
WACC Weighted average cost of capital
Ke Cost of equity
E/V Proportion of equity in capital structure
Kd Cost of debt
D/V Proportion of debt in capital structure
t Corporate tax rate
V Market value of business (where V = D + E)
Capital Asset Pricing Model
Model
Ke = Rf + β(Rm – Rf) + α
Components
Ke Cost of equity
Rf Risk free rate
β Beta, a measure of exposure to market risk
Rm Required return from investing in the market
Rm – Rf Equity market risk premium
α Company specific risk premium
Application to Specific Businesses
3. Selecting the risk-free rate (Rf)
Risk-free rates remain close to historical lows
June 2022
3.66%
December 2022
4.05%
Change
0.39%
The rise in government bond yields since June 2022 is likely to result in an increase in overall discount rates, all other things being equal.
Despite the recent rise in bond yields, risk-free rates remain at historically low levels. Rather than adopting current market observed risk-free rates, some valuers are adjusting observed risk-free rates to reflect a long-term average rate. However, some of these valuers are then not adjusting other parameters accordingly – leading to inconsistent and unreliable discount rate conclusions.
Leadenhall Solution:
We avoid the dangers of normalising by using market observed risk-free rates coupled with a contemporaneous assessment of the EMRP. This better reflects the current views implicit in capital markets and responds more quickly to changes in market pricing.
4. Assessing Beta (β)
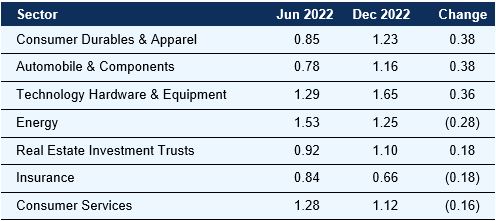
Observed industry betas have remained broadly unchanged
Source: RoZetta Institute Ltd – Risk Measurement Service as at 30 September 2022 (latest available)
There have been a number of moderate changes over the past six months and, out of 24 discrete industries reported, only the 7 industries above showed a change in the observed beta of 0.15 or greater.
Leadenhall Solution:
Rather than simply adopting an industry beta, we recommend undertaking a detailed analysis of the companies in a sector that have comparable risk to the business being valued. The betas for comparable companies should be based on data up to 31 December 2022 and generally need to be ‘ungeared’ to remove the impact of actual debt levels and then ‘re-geared’ to the optimal debt level (which is not necessarily the actual debt level) of the business being valued.
5. Cost of debt (Kd)
The cost of debt is generally related to the risk-free rate, with the difference being a credit spread. The following table shows that corporate lending rates have risen less than risk-free rates (indicating a slight narrowing of the credit spread) since June 2022. This is based on the yields of BBB-rated corporate bonds.
Lending rates are rising

Leadenhall Solution:
Instead of historical borrowing costs, the cost of debt should be based on the current borrowing cost – as if the business were to be refinanced in the current market at ‘optimal’ gearing levels.
6. Declining market risk premium
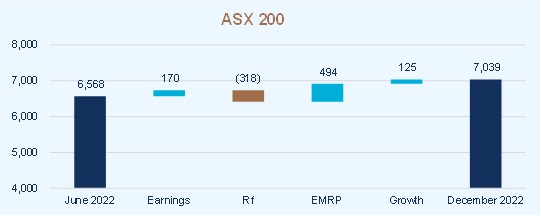
Equity market movements can be broken down into changes in earnings, changes in growth expectations and changes in discount rates. We then disaggregate the change in discount rates into movements in the risk-free rate and movements in the market risk premium in the following charts.
Decline in the implied EMRP
Source: Leadenhall
Note: Growth relates to longer-term growth expectations, not changes in near-term earnings.
The chart presented above shows an increase in the index driven by a decline in the EMRP and stronger earnings growth expectations in both the short and long-term. This was offset somewhat by an increase in the risk-free rate towards the end of December 2022.
Leadenhall Solution:
We have decreased our assessment of the EMRP from 6.25% at 30 June 2022 to 5.75% at 31 December 2022. This reflects the effect of the EMRP on market indices.
Leadenhall Solution:
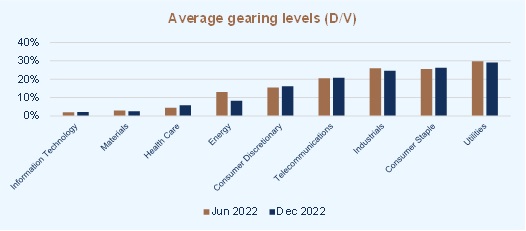
As with the cost of debt, the proportion of debt used in the calculation of WACC should be based on an optimal capital structure. This is not necessarily the actual level of debt in the company or the average observed in an industry at any particular point in time. The efficient or optimal level of debt included in a discount rate should be an assessment of the level of debt that can be sustained by the specific business or CGU over the medium to long term.
8. Our other concerns that may attract attention
Given the impact of the COVID-19 response on economic activity and the heightened uncertainty around future earnings and cash flows, emphasis should be placed not only on the discount rates adopted but on the preparation of robust cash flow projections. Some common issues we have observed are:
◆ Optimistic forecasts with insufficient allowance for capital investment and / or time to recovery
◆ Inconsistencies between the discount rate and cash flows
◆ Relying on a single valuation methodology without considering any cross-checks
Our difference
1 Accounting standard AASB 136 – Impairment of Assets requires value in use to be assessed with a pre-tax discount rate (paragraph 55). However, market practice in Australia is to perform this analysis using a post-tax discount rate (and post-tax cash flows), with the implied pre-tax discount rate being disclosed in the financial statements.


